Vol Graph
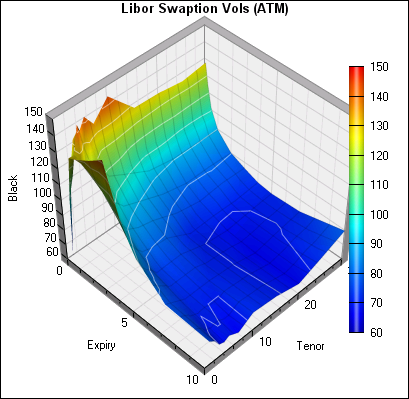
Did you know you can visually check for spikes and outliers in volatilities using the Vol Graph tab of our Market Rates dialog? The graph can be generated across any unit and slice of the surface. Click here to see a snapshot of the ATM Lognormal Vol Surface on 01/31/2020 and 03/31/2020.
01/31/2020:
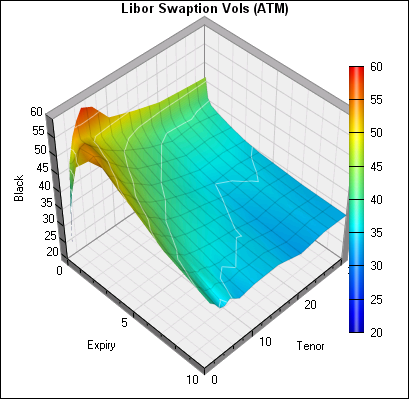
03/31/2020: